It’s all about data these days. Leaders don’t want to make decisions unless they have evidence. That’s a good thing, of course, and fortunately there are lots of ways to get information without having to rely on one’s instincts. One of the most common methods, particularly in online settings, is A/B testing. A/B testing is a way to compare two versions of something to figure out which performs better.
A/B testing is helpful for comparing two versions of a webpage, email newsletter, subject lines, designs, apps, and more or to see which is more successful.
How Does A/B Testing Work?
To run an A/B test, you need to create two different versions of one piece of content, with changes to a single variable. You start an A/B test by deciding what it is you want to test. Suppose you want to find the best size of the subscribe button on your website. Then you need to know how you want to evaluate its performance. In this case, let’s say your metric is the number of visitors who click on the button. To run the test, you show two sets of users (assigned at random when they visit the site) the different versions (where the only thing different is the size of the button) and determine which influenced your success metric the most. In this case, which button size caused more visitors to click?
In real life there are lots of things that influence whether someone clicks. For example, it may be that those on a mobile device are more likely to click on a certain size button, while those on desktop are drawn to a different size. This is where randomization can help — and is critical. By randomizing which users are in which group, you minimize the chances that other factors, like mobile versus desktop, will drive your results on average.
As with all randomized controlled experiments, you must estimate the sample size you need to achieve a statistical significance, which will help you make sure the result you’re seeing “isn’t just because of background noise,”
Interpret Results of an A/B Test
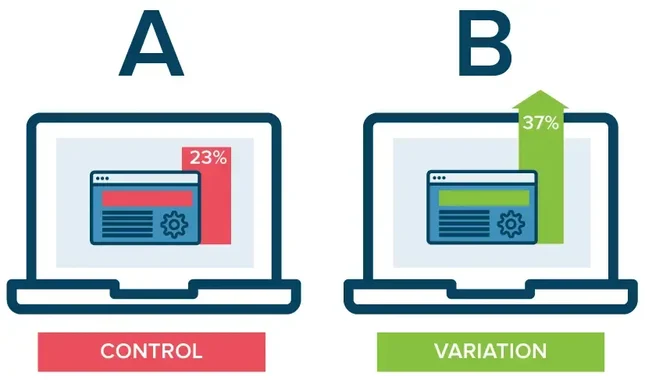
The existing design (Control) — is version A. Version B is with the different size of subscribe button (Variation). Ideally, the percentage of visitors seeing either version is the same.
Most software programs report two conversion rates for A/B testing: one for users who saw the control version, and the other for users who saw the test version. The conversion rate may measure clicks, or other actions taken by users. The report might look like this: Control: 23% (+/- 2.4%) Variation 37% (+/- 2.6%).” This means that 37% of your users clicked through on the new variation (perhaps your larger blue button) with a margin of error of 2.3%. If you ran your A/B test multiple times, 95% of the ranges will capture the true conversion rate — in other words, the conversion rate falls outside the margin of error 5% (2.4 + 2.6) of the time.