Introduction
Camera light meter determine light in on your scene in order to set the optimal combination of aperture size, shutter speed, and ISO sensitivity to get the photo you want.
Light Meter
The light meter appears when you are looking through your camera’s viewfinder. It’s activated by pressing the shutter button and measures the intensity of the light at various points across the entire scene. The light meter displays an overall reading of the light as a number below or above zero, which is considered to be the centre. Below zero indicates darkness or underexposure, and above zero indicates brightness or overexposure. It’s up to you to decide what to do after reviewing the information the light meter gives you.

Measuring Light
In order to accurately expose a greater range of subject lighting, cameras have several metering options. Each option works by assigning a relative weighting to different light regions; regions with a higher weighting are considered more reliable, and thus contribute more to the final exposure calculation. Most cameras today have a few basic ways of measuring the incoming light:
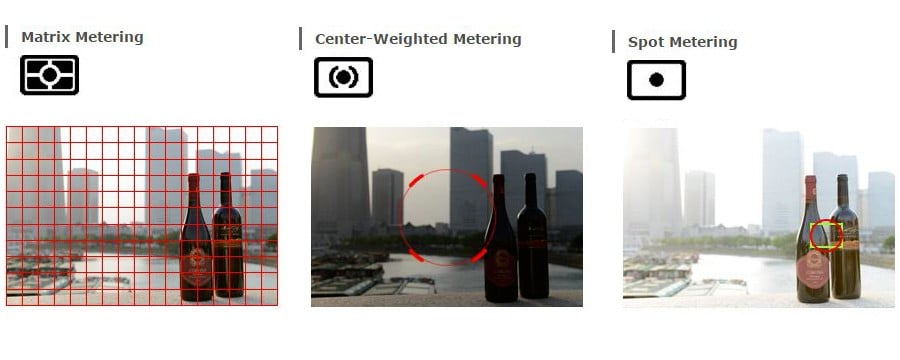
- Matrix or Evaluative Metering – the camera looks at the light in the entire scene and averages it.

- Center-Weighted Average Metering – looks at the light of the entire scene and averages it, but with emphasis on the center of the frame.

- Partial Metering – this measures the light only in a small portion of the center of the frame.

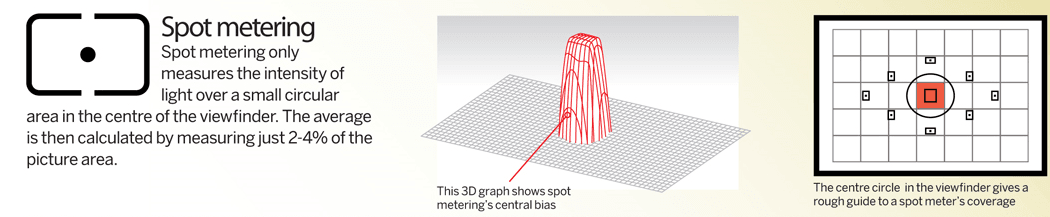
- Spot Metering – measures the light only in a small area around the central autofocus point.
Below figure shows the effect of choosing different metering option in the camera
 Histogram
Histogram is a graph that you can choose to display on your camera’s LCD screen that helps you read the light better. Too much dark and the histogram will bunch up on the left side, too much light and its bunches up on the other. A histogram is especially useful when the light frequently changes, as a reminder to adjust your camera settings.
The histogram is a graph that represents the spread of tones in a photograph, from the shadows, to the mid tones to the highlights. It allows you to check if the photograph has any shadows that are too dark or ‘clipped’ and to see if you have any highlights that are too bright or ‘blown out’. Clipped shadows are areas of pure black and contain no detail. Blown out highlights are areas of pure white and also contain no detail. Very generally speaking, you will want to avoid both of these.

Below figure shows underexposed photo, an overexposed photo and a correctly exposed photo.
- Underexposed photograph : Histogram is completely bunched up to the left.
- Overexposed photograph : Histogram is bunched up to the right.
- Correctly exposed photograph: Histogram has a good spread of shadows, mid-tones and highlights.
