Moving Average Convergence Divergence (MACD)
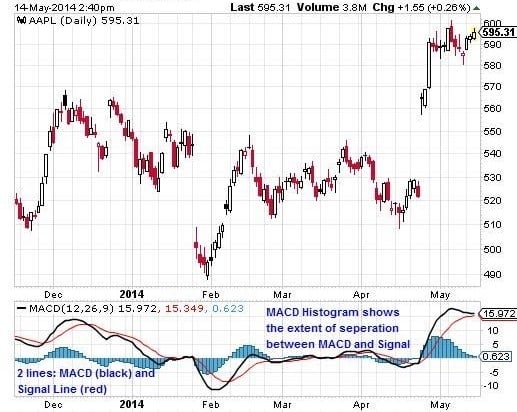
Developed by Gerald Appel, the Moving Average Convergence/Divergence oscillator (MACD) turns two trend-following indicators, moving averages, into a momentum oscillator by subtracting the longer moving average from the shorter moving average. As a result, the MACD offers the best of both worlds: trend following and momentum. The MACD fluctuates above and below the zero line as the moving averages converge, cross and diverge. Traders can look for signal line crossovers, centerline crossovers and divergences to generate signals. Two lines compose the MACD: the MACD line and Signal line. These lines move together, except the MACD moves faster as the Signal line is a moving average of the MACD line. The MACD is calculated as follows:
MACD Line = 12day EMA – 26day EMA
Signal Line = 9day EMA of MACD Line
EMA stands for exponential moving average.
The MACD Histogram is the MACD Line – Signal Line
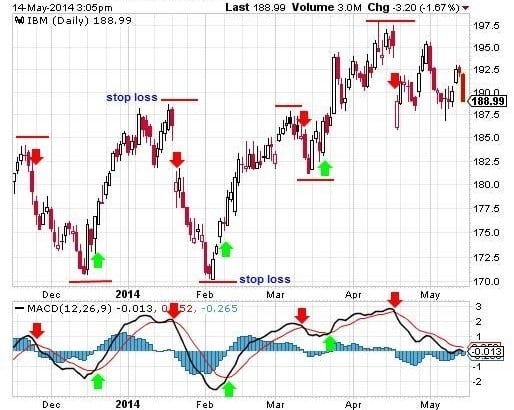
The MACD Histogram that oscillates above and below zero shows the extent to which the MACD line is above or below signal line. The histogram provides a short-term view on recent momentum and direction. When the histogram is above zero, recent movement has been higher; below zero and the recent momentum was down. The greater the histogram value the greater the momentum of the recent move. Below figure shows the MACD applied to a daily chart.
Zero-Line Crossovers
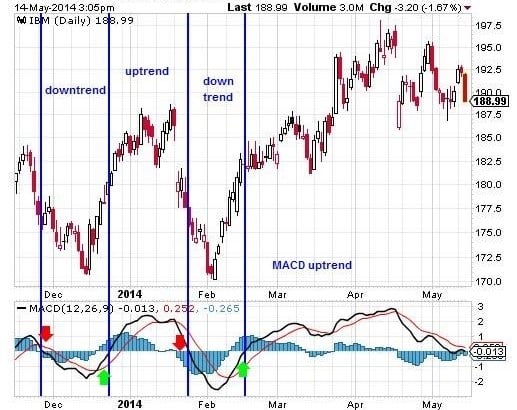
Moves across the zero line on the indicator represent times when the 12day EMA is crossing the 26day EMA. When the MACD crosses the zero line from below, a new uptrend may be emerging. When the MACD crosses the zero line from above a new downtrend may be emerging. The strategy is to buy when the MACD crosses above the zero line, and sell (or take short positions) when the MACD line (black) crosses below the zero line. During choppy conditions this results in losing trades, and is profitable when strong trends emerge.
Signal Line Crossovers
Signal line crossovers provide better timing, and are preferred by most traders to zero-line crossovers. With this method, a buy signal occurs when the MACD line crosses above the Signal line. A sell (short) signal occurs when the MACD line crosses below the Signal line. The buy and sell signals occur earlier in the price move than zero-line crossovers, potentially providing better entry and exit prices. Below figure shows MACD Signal Line Crossover.